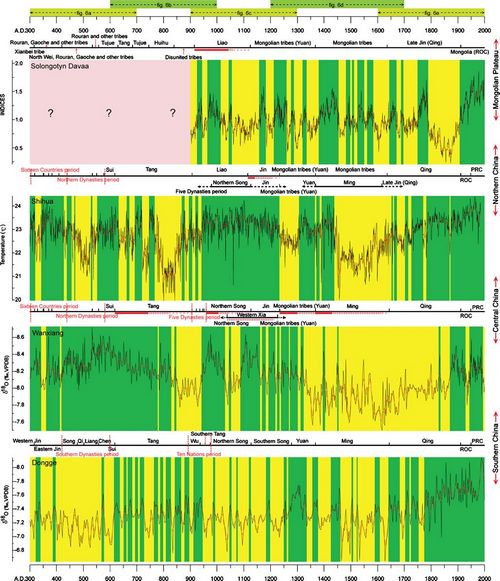
During the past several thousand years, northern China and the Mongolian Plateau have experienced multiple desertification cycles, which have been recorded in both Chinese historical documents and palaeoclimate records for this region. By analyzing and comparing these data comprehensively, Prof. Xunming Wang and his some colleagues from the CAEERI have provided some strong, wide-scale, and long-term evidence to support the hypothesis that there are close relationships between expanding desertification and the collapse of Chinese dynasties.
Their research results show that desertification and food production trends in the Mongolian Plateau and in northern, central, and southern China have paralleled the rise, decline, and collapse of China’s historical dynasties (see Fig.1). During the reversal of desertification, the dynasties founded in Mongolia and northern China flourished, and governed most of ancient China. In contrast, desertification in northern China and the Mongolian Plateau allowed southern dynasties to conquer or share dominion over these areas with the northern dynasties. During desertification, biological productivity also typically decreased, leading to periods of conflict.
Although social, cultural, and economic factors undoubtedly played a role in the fates of Chinese dynasties, the role of the environment may have been neglected. The results of the present study demonstrate that the rise and collapse of China’s dynasties were closely related to (respectively) favorable and adverse climate change, and although correlation does not imply causality. These results will no doubt contribute to future discussions of the relationships among climate, desertification, and social changes during historical periods. The above-mentioned research results have been published in a newly issue of Human Ecology.

Fig. 1 Cycles of desertification and biological productivity during historical dynastic periods in the Mongolian Plateau and in northern, central, and southern China from 300 to 2000 A.D. The red lines show the 10-year smoothing results produced by means of adjacent averaging. Increased desertification and decreased biological productivity are shown in yellow, whereas the reversal of desertification and increased biological productivity are shown in green. Red lines associated with the dynasty names below the graphs indicate periods of flourishing (solid red) and decline (dashed red) for these dynasties based on historical data.

