Understanding the dynamics and underlying mechanism of carbon exchange between terrestrial ecosystems and the atmosphere is one of the key issues in global change research.
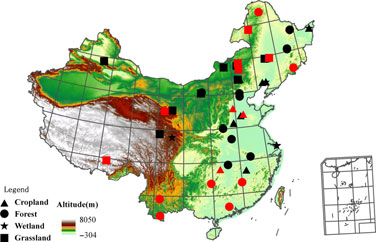
In this study, we quantified the carbon fluxes in different terrestrial ecosystems in China, and analyzed their spatial variation and environmental drivers based on the longterm observation data of ChinaFLUX sites and the published data from other flux sites in China.
The results indicate that gross ecosystem productivity (GEP), ecosystem respiration (ER), and net ecosystem productivity (NEP) of terrestrial ecosystems in China showed a significantly latitudinal pattern, declining linearly with the increase of latitude.
However, GEP, ER, and NEP did not present a clear longitudinal pattern. The carbon sink functional areas of terrestrial ecosystems in China were mainly located in the subtropical and temperate forests, coastal wetlands in eastern China, the temperate meadow steppe in the northeast China, and the alpine meadow in eastern edge of Qinghai- Tibetan Plateau. The forest ecosystems had stronger carbon sink than grassland ecosystems. The spatial patterns of GEP and ER in China were mainly determined by mean annual precipitation (MAP) and mean annual temperature (MAT), whereas the spatial variation in NEP was largely explained by MAT. The combined effects of MAT and MAP explained 79%, 62%, and 66% of the spatial variations in GEP, ER, and NEP, respectively. The GEP, ER, and NEP in different ecosystems in China exhibited ‘positive coupling correlation’ in their spatial patterns. Both ER and NEP were significantly correlated with GEP, with 68% of the per-unit GEP contributed to ER and 29% to NEP. MAT and MAP affected the spatial patterns of ER and NEP mainly by their direct effects on the spatial pattern of GEP.

Fig. Distribution of carbon flux observation sites used in this study in China.
Note: the data marked in red are sites from ChinaFLUX, background is the 1 km DEM and Qinghai-Tibetan Plateau is in the southwest of China.
Additional Information:
1. Author Information:Gui-Rui Yu, Xian-Jin Zhu, Yu-Ling Fu, Hong-Lin He, Qiu-Feng Wang, Xue-Fa Wen, Xuan-Ran Li, Lei-Ming Zhang, Li Zhang, Wen Su, Sheng-Gong Li, Xiao-Min Sun, Yi-Ping Zhang, Jun-Hui Zhang, Jun-Hua Yan, Hui-Min Wang, Guang-Sheng Zhou, Bing-Rui Jia, Wen-Hua Xiang, Ying-Nian Li, Liang Zhao, Yan-Fen Wang, Pei-Li Shi, Shi-Ping Chen, Xiao-Ping Xin, Feng-Hua Zhao, Yu-Ying Wang And Cheng-Li Tong
Correspondence: E-mail: yugr@igsnrr.ac.cn
2. Publication History: Global Change Biology, 19, 798–810

