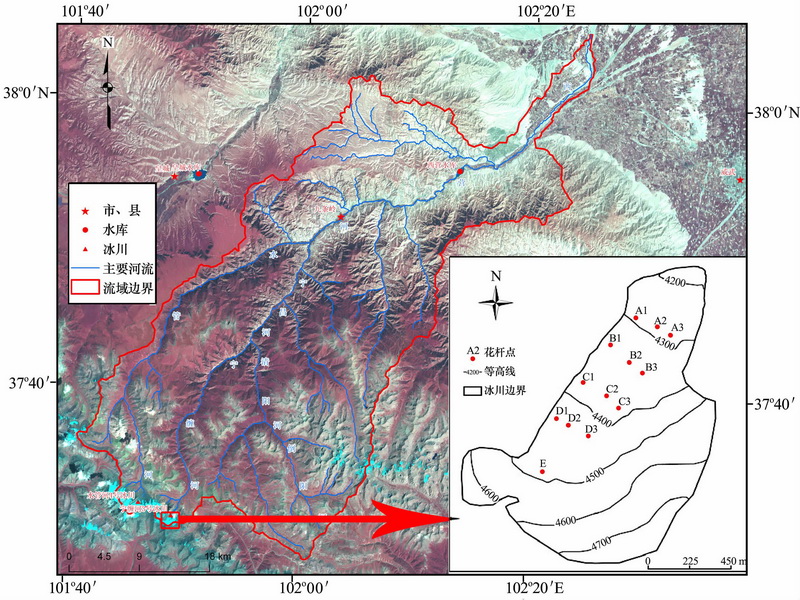
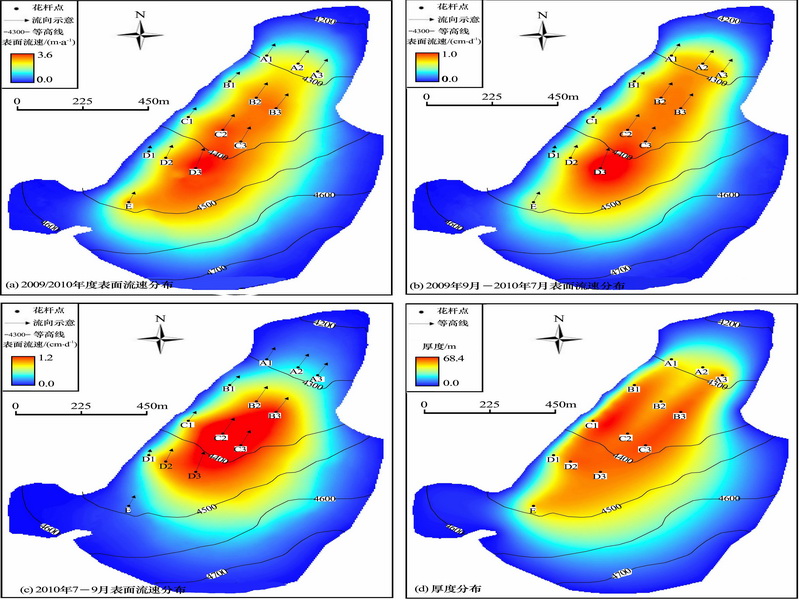
In September 2009, the expedition established a geodetic chain around the Ningchan River Glacier No. 3, and 13 mark points were installed on the glacier surface for surveying glacier flow velocity. In July 2010 and September 2010, the mark points were surveyed again and again, and the surface flow velocities of the glacier were determined for the periods of 2009/2010, September 2009-July 2010 and July 2010-September 2010. It is found that the maximum surface flow velocity was 3.76 m•a-1(at the elevation of 4430 m) for the periods of 2009/2010, 0.32m•month-1(at the elevation of 4430m) in the time bucket from September 2009 to July 2010 and 0.47m•month-1(at the elevation of 4380m) in the time bucket from July 2010 to September 2010. Overall, in 2009/2010, the variation of surface flow velocity was smaller and showed an elevation-dependence along a longitudinal section; along a transverse section the maximum surface flow velocity was close to the main flow line and gradually decreasing to the both sides. All flow direction was parallel to the main flow line, directing the glacier terminal. In the surveyed area, it is found that the surface flow velocities of the southeast edge were faster than those of the northwestern edge. As compared with other glaciers which have similar glacierized area, the flow velocity of the Ningchan River Glacier No.3 is faster.
This research was supported by the National Natural Science foundation of China (41071046; 41201067; 41071043), the Independent Subject of the State Key Laboratory of Cryospheric Sciences, and the Basic Talents Cultivation Foundation, NNSF (J1210003/J0109).

Map of Ningchan River Glacier No.3

Two-dimensional distributions of surface flow velocity (a,b and c) and depth(d) of the Ningchan River Glacier No.3

