In water-limited regions, rainfall interception is influenced by rainfall properties and crown characteristics. Rainfall properties, aside from gross rainfall amount and duration (GR and RD), maximum rainfall intensity and rainless gap (RG), within rain events may heavily affect throughfall and interception by plants.
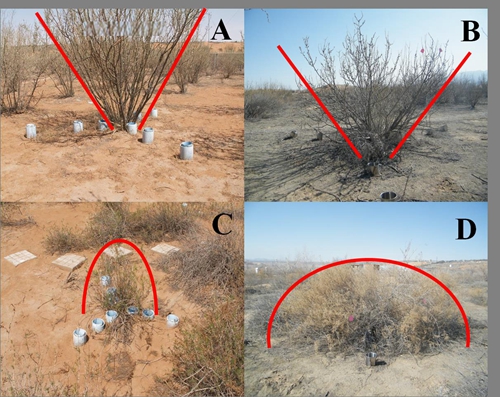
From 2004 to 2014 (except for 2007), individual shrubs of Caragana korshinskii and Artemisia ordosica were selected to measure throughfall during 210 rain events (Fig.1). Various rainfall properties were auto-measured and crown characteristics, i.e., height, branch and leaf area index, crown area and volume of two shrubs were also measured.
The relative interceptions of C. korshinskii and A. ordosica were 29.1% and 17.1%, respectively. Rainfall properties have more contributions than crown characteristics to throughfall and interception of shrubs. Throughfall and interception of shrubs can be explained by GR, RI60 (maximum rainfall intensities during 60 min), RD and RG in deceasing importance. However, relative throughfall and interception of two shrubs have different responses to rainfall properties and crown characteristics, those of C. korshinskii were closely related to rainfall properties, while those of A. ordosica were more dependent on crown characteristics (Fig.2).
We highlight long-term monitoring is very necessary to determine the relationships between throughfall and interception with crown characteristics.
This research was funded by the National Basic Research Program of China (2013CB429901), the National Natural Sciences Foundation of China (41471434 and 41501270) and Foundation for Excellent Youth Scholars of CAREERI, Chinese Academy of Sciences. The research was published in Scientific Reports belonging to Nature Publishing Group.
URL: http://www.nature.com/articles/srep26030

Fig. 1:Pictures showing the individual C. korshinskii used to measure throughfall during 2004-2006 (A) and 2008-2014 (B), and the individual A. ordosica used to measure throughfall during 2004-2006 (C) and 2008-2014 (D) in study site. The red line in pictures shows the shape of shrubs.

Fig. 2:Comprehensive analysis on relationships between TC (A), TA (B), IC (C), IA (D), TC/GR (E), TA/GR (F), IC/GR (G) and IA/GR (H) with rainfall properties (GR, RD, RI60and RG) and crown characteristics (H, BLAI, CA and CV). The bold solid line means p < 0.001, solid line means p < 0.01, dashed line means p < 0.05, and dottted line means p < 0.1. The number above the line is R2 value from univariable regression analysis. “−” means negative relationship.

