An R package was developed for computing permafrost indices (PIC v1.3) that integrates meteorological observations, gridded meteorological datasets, soil databases, and field measurements to compute the factors or indices of permafrost and seasonal frozen soil.
At present, 16 temperature-and depth-related indices are integrated into the PIC v1.3 R package to estimate the possible trends of frozen soil in the Qinghai-Tibet Plateau (QTP).
These indices include the mean annual air temperature (MAAT), mean annual ground temperature (MAGT), seasonal thawing-freezing n factor (nt/nf), thawing-freezing degree-days for air and the ground surface (DDTa/DDTs/DDFa/DDFs), temperature at the top of the permafrost (TTOP), active layer thickness (ALT), and maximum seasonal freeze depth.
PIC v1.3 supports two computational modes, namely the stations and regional calculations that enable statistical analysis and intuitive visualization of the time series and spatial simulations.
Datasets of 52 weather stations and a central region of the QTP were prepared and simulated to evaluate the temporal-spatial trends of permafrost with the climate.
More than 10 statistical methods and a sequential Mann-Kendall trend test were adopted to evaluate these indices in stations, and spatial methods were adopted to assess the spatial trends.
Multiple visual methods were used to display the temporal and spatial variability of the stations and regions.
Simulation results show extensive permafrost degradation in the QTP, and the temporal-spatial trends of the permafrost conditions in the QTP are close to those of previous studies.
The transparency and repeatability of the PIC v1.3 package and its data can be used and extended to assess the impact of climate change on permafrost.
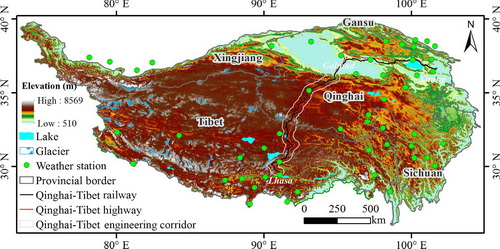
Map of the data location over the QTP